Better Business Insights
You’ve got your financial statements.
But what are they actually saying?
Four outputs delivered with your annual accounts that show you what your business is really doing — in plain English, not accounting language.

Every year, you get a set of financial statements. A compliance letter. Maybe a brief conversation about tax.
And every year, the same question sits in the back of your mind:
“I made money… so why does it feel like I’m going backwards?”
The numbers exist. The insight doesn’t. Most accountants tell you what happened. I tell you what it means — for your business, your time, your life, and what comes next.
Better Business Insights changes that. It translates your results into four outputs that answer the questions your financial statements never do.
Four outputs. Four truths.
OUTPUT ONE
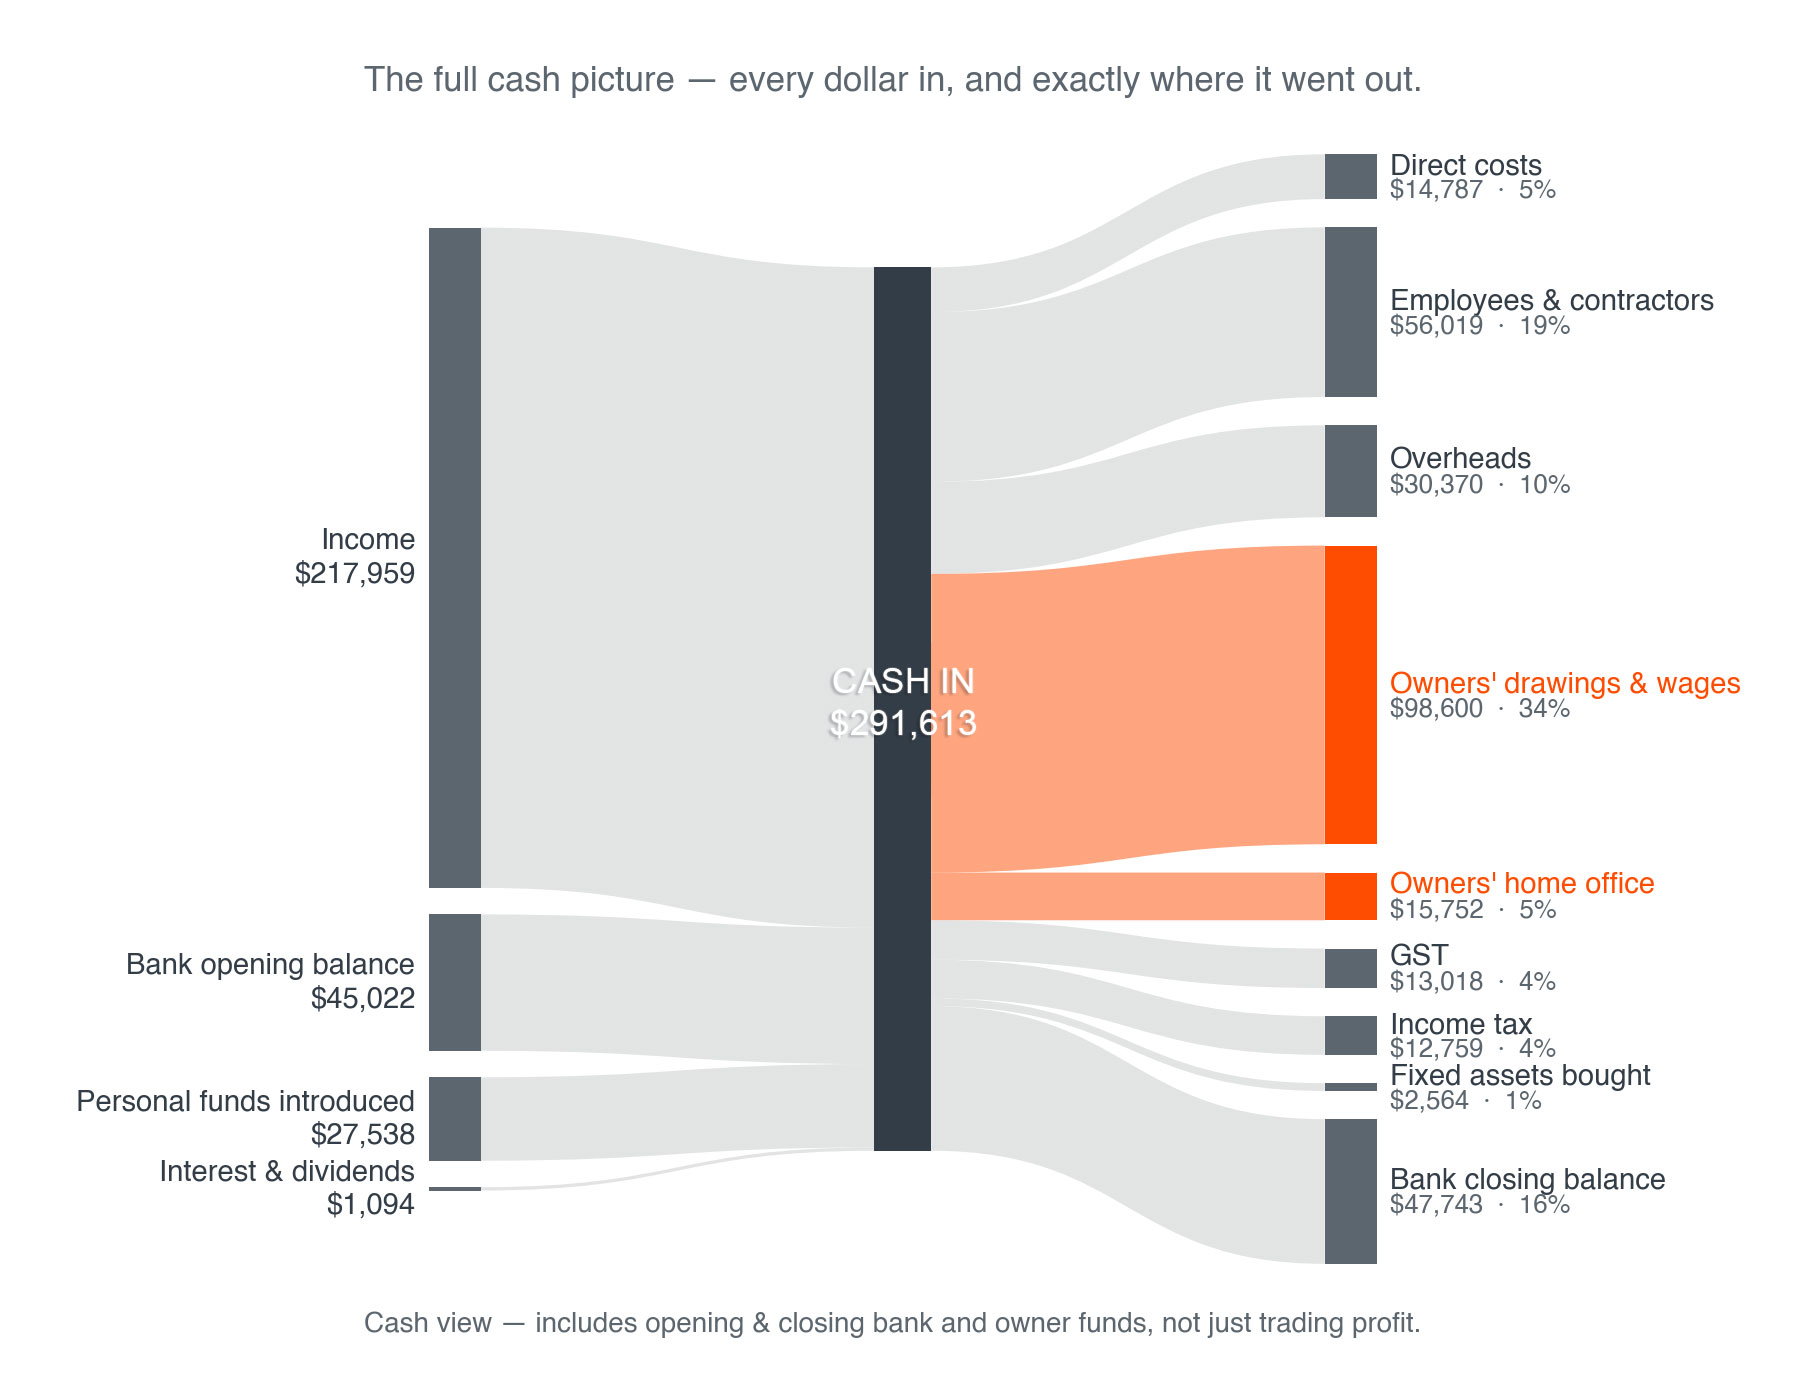
Where your money actually went
“I made $X profit but my bank account says otherwise — why?”
A single visual that traces every dollar from where it came in to where it went out. Income, direct costs, overheads, tax, what you actually took home. No spreadsheets. No jargon. One picture that answers the question you’ve been asking for years.
OUTPUT TWO
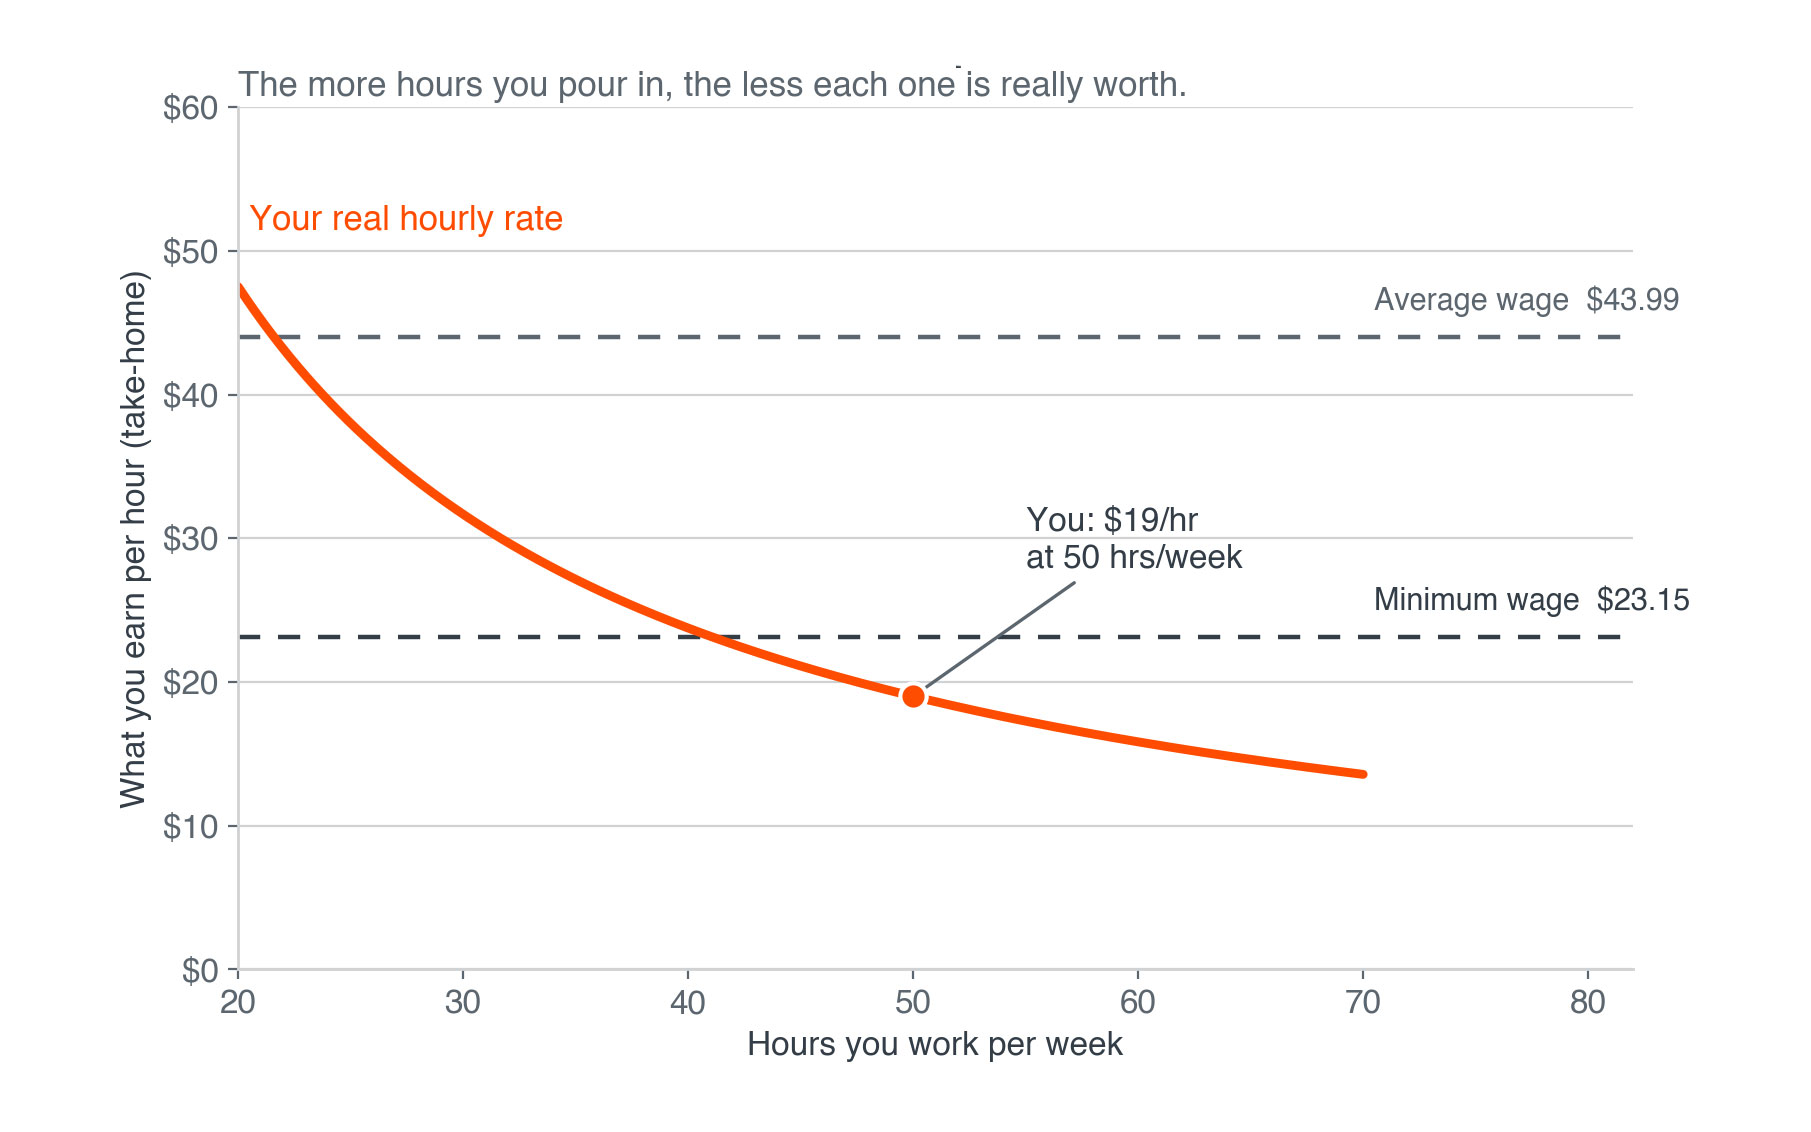
What you’re actually earning per hour
“Am I even paying myself properly?”
A graph that plots your compensation per hour against minimum wage and the average wage — across different weekly hours. You find yourself on it. For many owners, this is the moment the conversation starts. Because the answer is often less than they think. Sometimes a lot less.
OUTPUT THREE
Where your business actually stands
“How do I know if I’m on track or just surviving?”
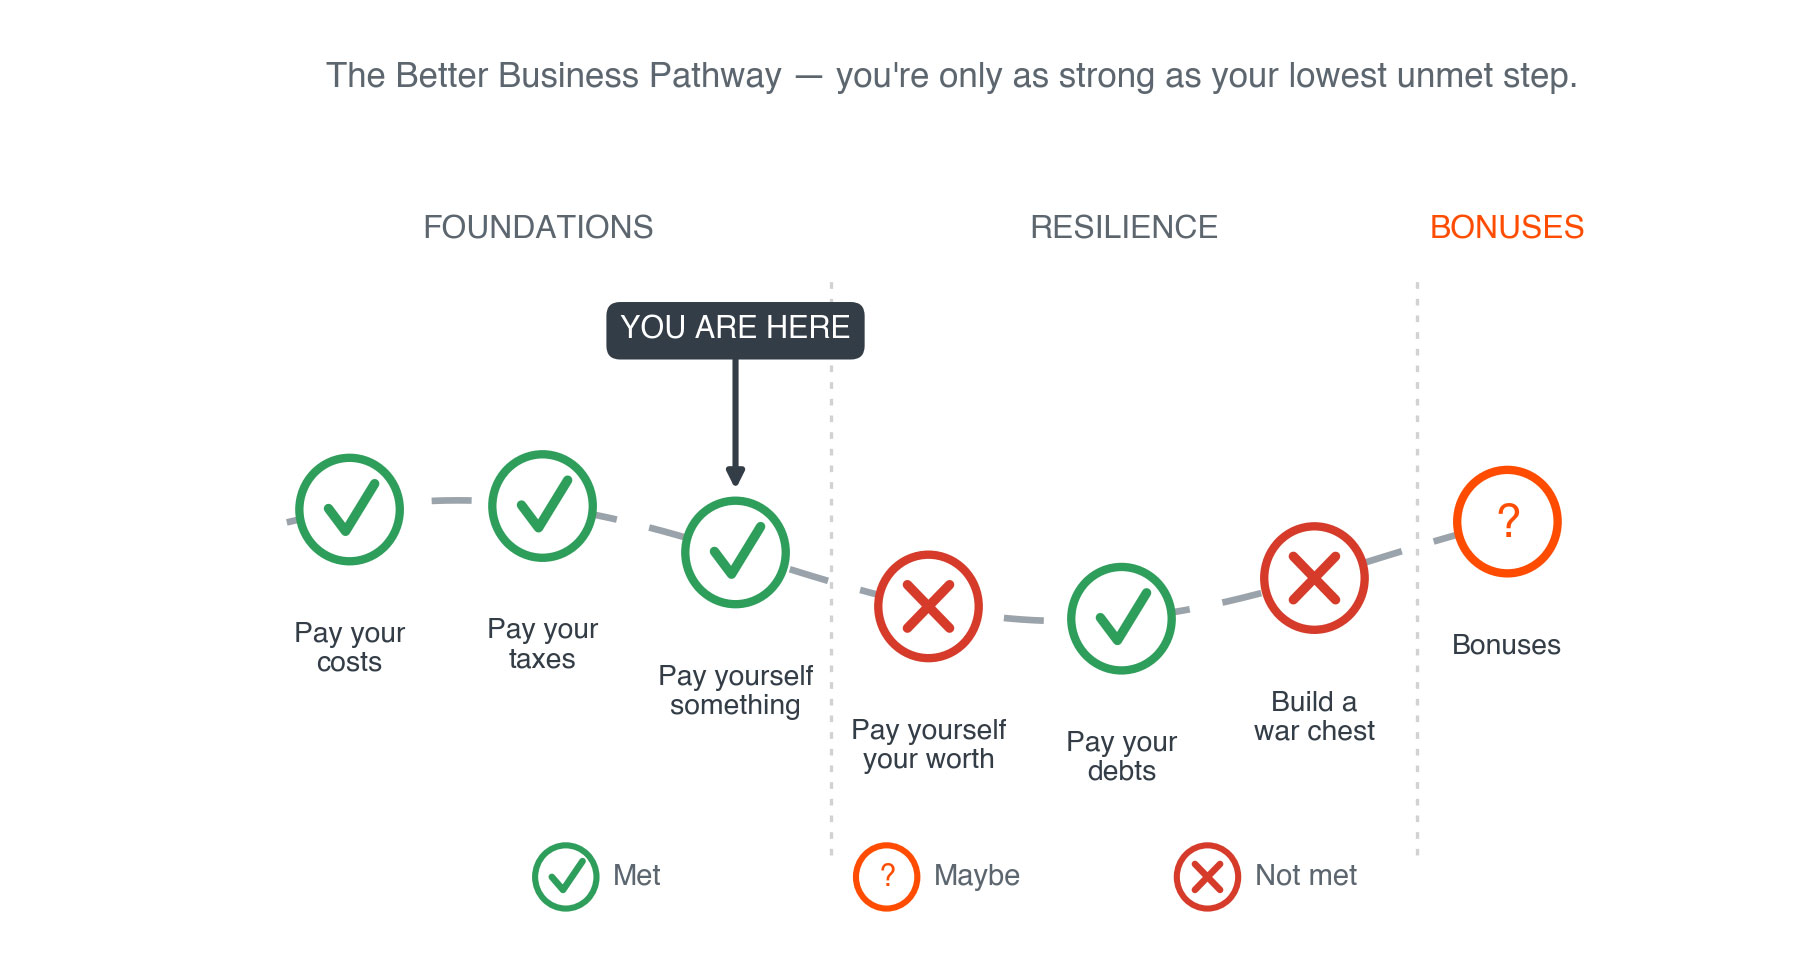
A simple diagnostic against the stages that matter: Can you pay your costs? Are your taxes current? Are you getting something from this? Are you getting what you’re worth? Do you have a war chest? Are your debts managed? Each one answered with evidence from your own numbers — not opinion, not benchmarks, not someone else’s framework. Yours.
OUTPUT FOUR
A rough guide to what your business could be worth
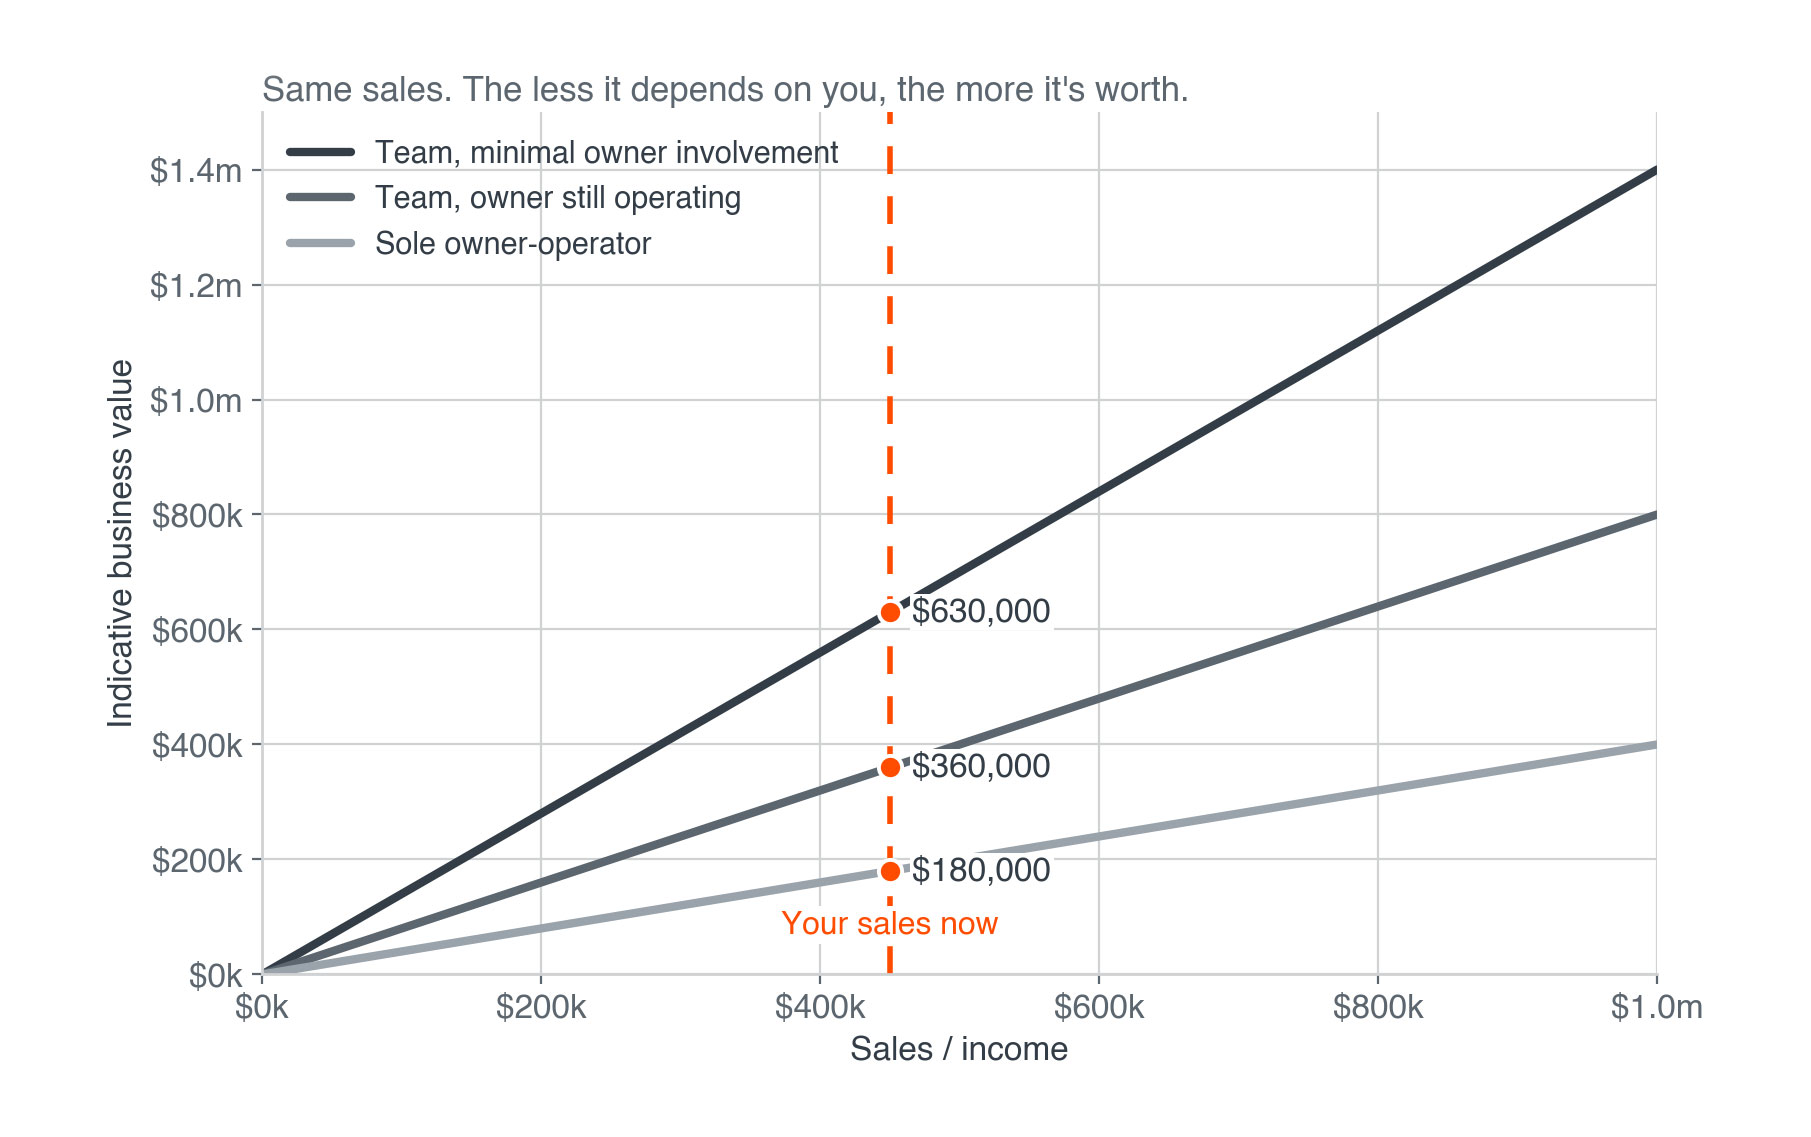
“If I had to sell tomorrow, what ballpark am I in?”
An indicative value — not a formal valuation. Think of it like bathroom scales: it doesn’t have to be perfect, because we’re interested in the direction more than the exact measurement. A proper business valuation requires a qualified valuer. This gives you a close-enough guide based on your actual results, without the expense and time. Like a real estate agent’s appraisal — a useful indicator, knowing that the actual value is ultimately whatever a willing buyer and willing seller agree on.
Why this matters
Most business owners make decisions based on gut feel, bank balance, and whatever the last person told them. Not because they’re careless — because nobody has shown them what the numbers actually mean in terms they can use.
Better Business Insights doesn’t give you more data. It gives you sight.
When you can see where the money goes, what you’re really earning, where the gaps are, and what the business is actually worth — the decisions change. Not because someone told you what to do. Because you can see what’s true.
This is a snapshot. What’s true right now. If you want to know what’s driving these results and how to change them, that’s a different conversation.
That’s the point. The data does the talking. I just make sure you can hear it.
How it fits together
Better Business Insights is delivered with your annual financial statements. It’s not a separate service — it’s what your accounting relationship should have included all along.
Your Accounts
Your Insights
Your Choice
Some clients look at the insights, understand what’s happening, and make changes on their own. That’s a win.
Some look at the insights and realise they need a deeper conversation about what’s driving the results — not just the results themselves. That’s where Better Business Way starts.
Either way, the insights are yours. No pitch. No pressure. Just the truth about what your business is doing.
What a real insight looks like
You run a trade business. Revenue is up 12% on last year. Profit looks healthy. You should be feeling good.
But the Sankey chart shows 38% of your income is coming from one client. The compensation graph shows you’re earning $19/hour net at 50 hours a week. The diagnostic shows you don’t have a war chest and your tax is behind. And the indicative value suggests your business is in the ballpark of $180,000. After a decade and a half.
Revenue is up. But you’re more exposed, more underpaid, and more fragile than last year — and the business you’ve spent all that time building might not pay off your mortgage.
That’s what insight looks like. Not more numbers — the meaning behind the numbers you already have.
Want to know what your numbers are actually saying?
If you’re already a client, these insights are included with your next set of accounts.
If you’re not — this is what an accounting relationship should look like.
No pitch. No obligation.
Just a conversation about what I can see and what you can’t.
Some clients look at these outputs and want to understand what’s driving the results — comparisons, trends, what changes when they change things. That deeper analysis is part of Better Business Way.